Farinograph
What is a Farinograph?
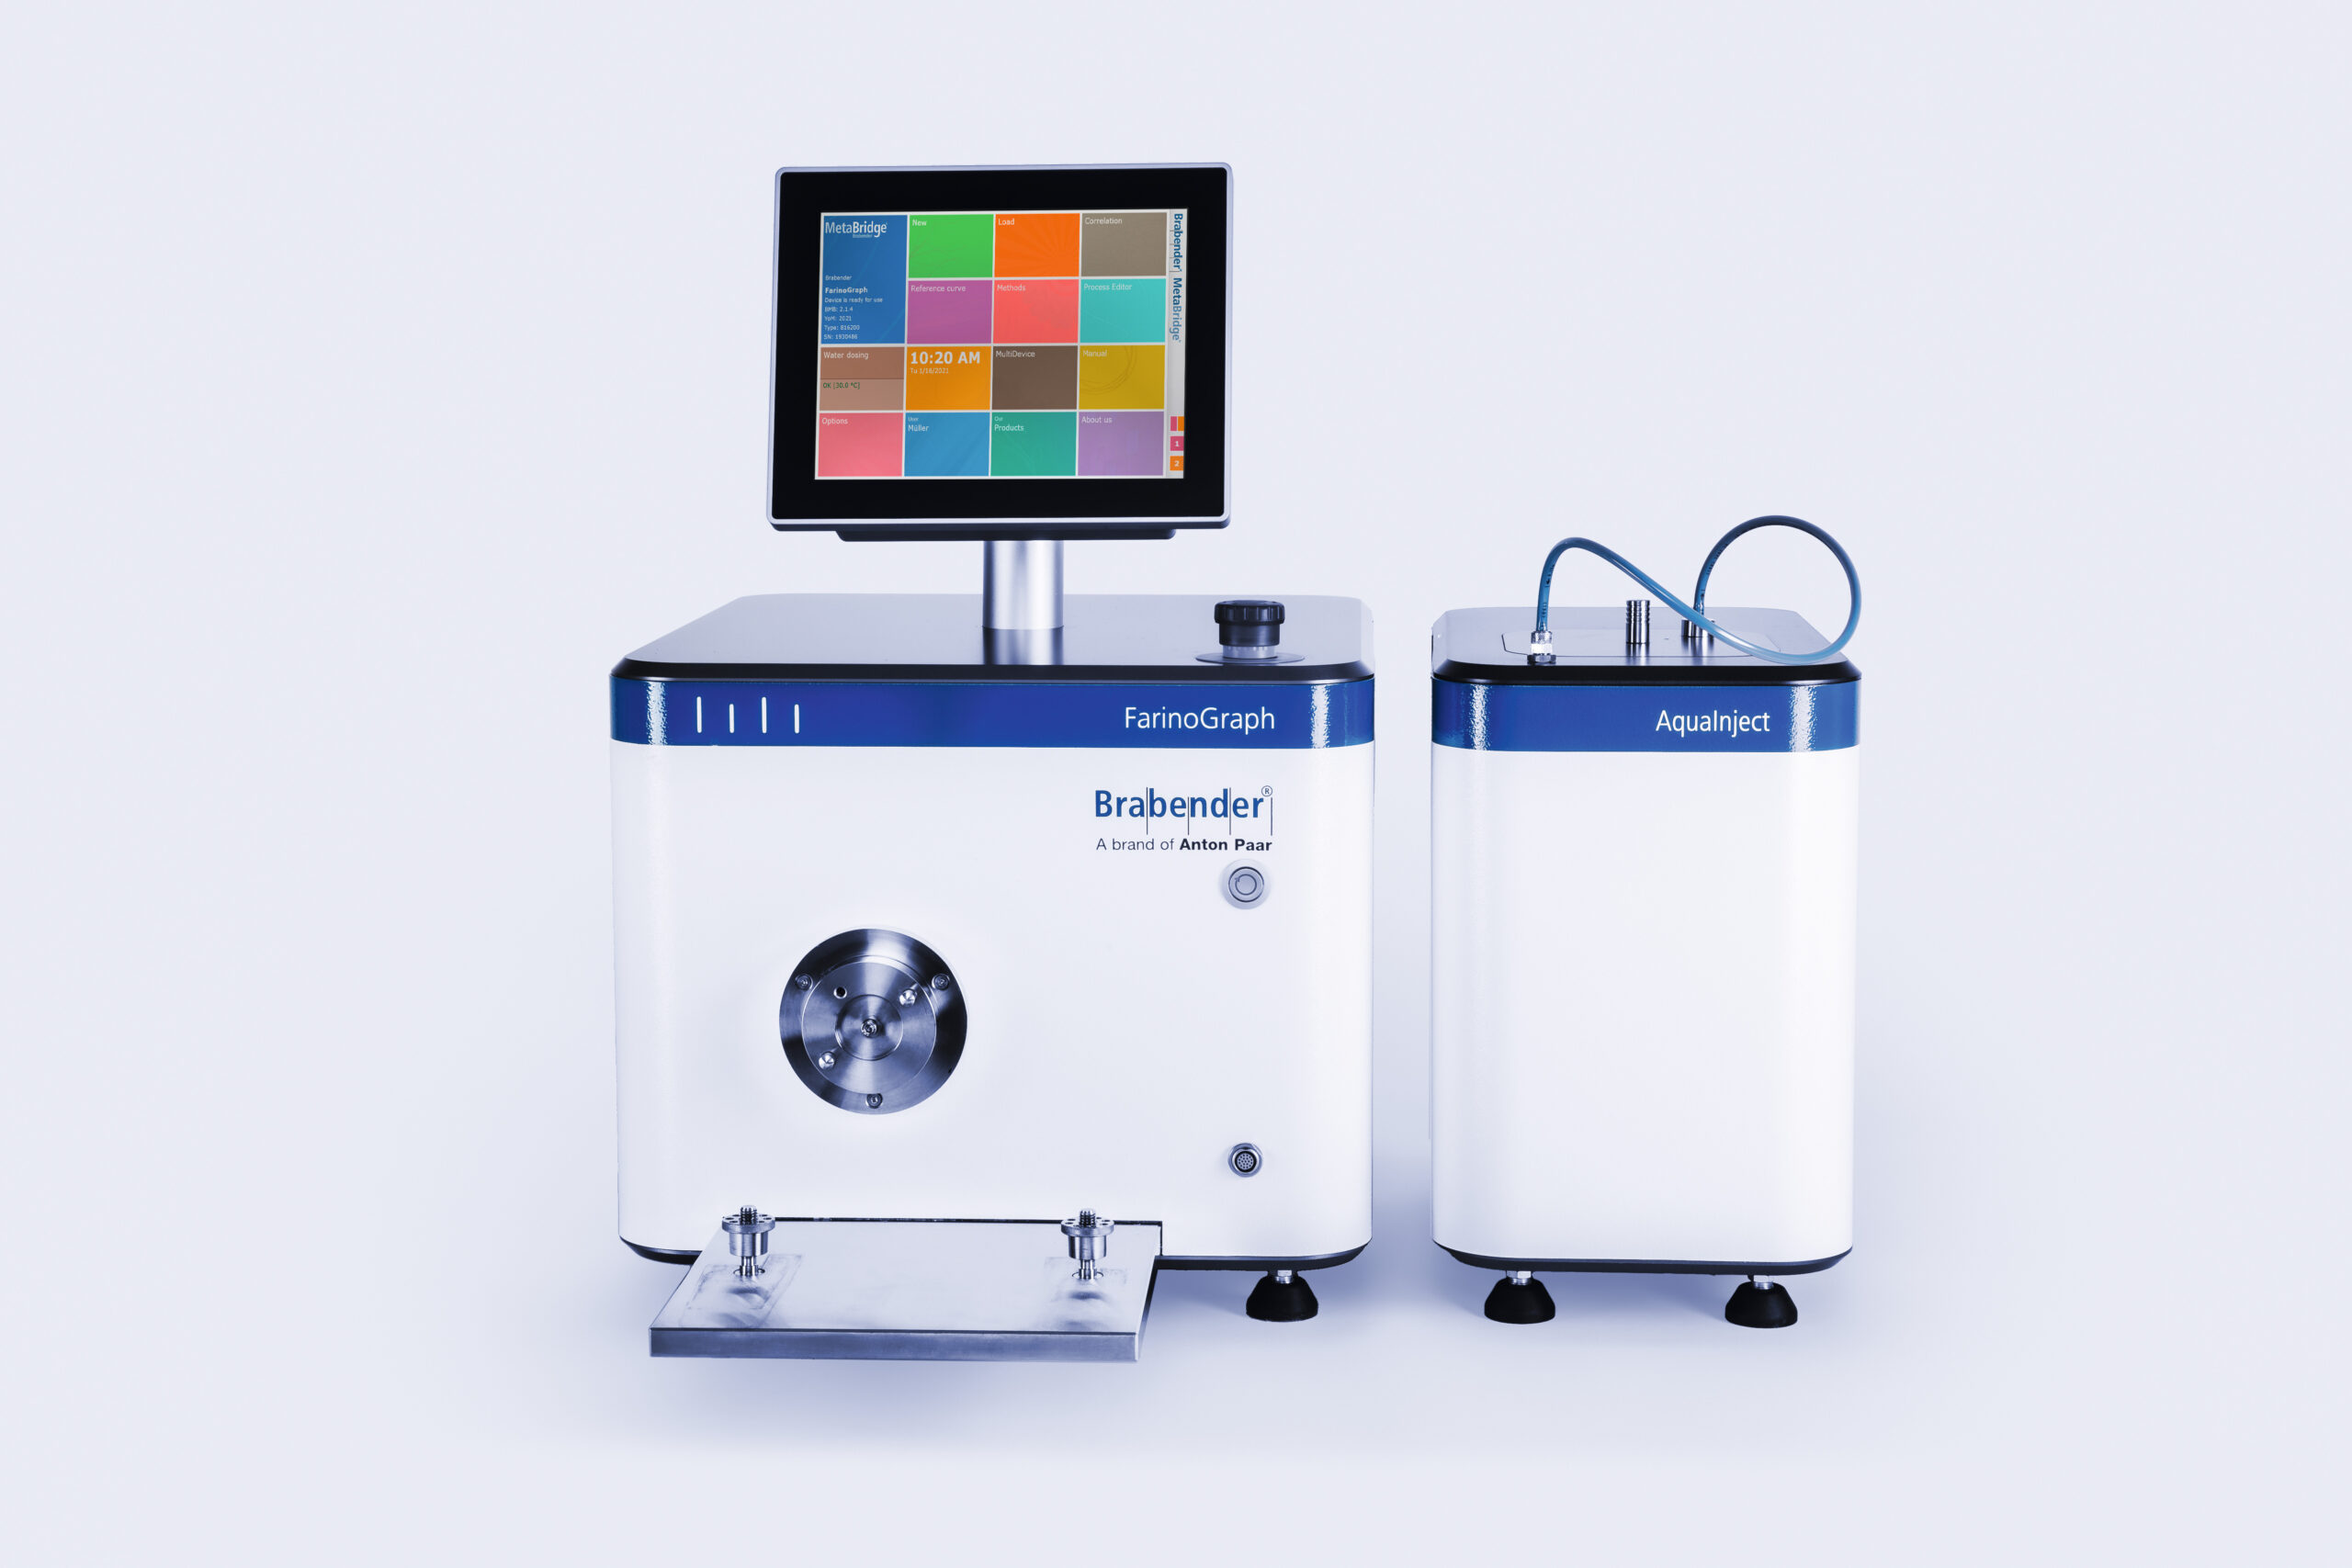
The farinograph is a tool to assess baking qualities and performance of wheat flour doughs. It records the resistance to deformation, or the consistency of dough mixed from flour and water.
To millers and bakers, farinographs are essential for:
- Adjusting dough mixing parameters: absorption, time, pre-hydration ratio
- Studying the effect of flour improvers dough handling properties
- Establishing quality control measures to properly handle wheat crop changeovers
- Preparing wheat and flour blends to comply with flour specifications
Origin
The invention of the farinograph dates back to 1928 when Carl Brabender of Germany established a method for measuring the baking qualities of bread flour.
How does it work?
Farinographs measure and record the resistance to deformation of a flour/water dough against the mixing action of blades over time and at a specific speed (rpm) and temperature. Dough resistance is expressed as motor torque, in dimensionless units known as Farinograph or Brabender Units (FU or BU). During the test, the dough is developed and further broken down.1,2
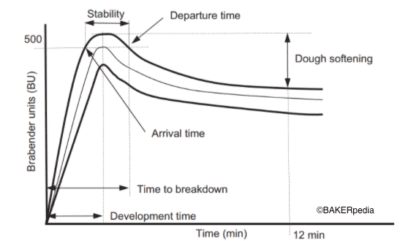
Resistance has traditionally been known as “consistency.” The maximum consistency of the dough is adjusted to a fixed value (500 FU) by altering the quantity of water added (i.e. % absorption). This is a key measurement in dough rheology testing.
AACC International Method 54-21
Using this method:
- 300 g of flour (14% moisture basis) are placed in the farinograph bowl.
- Water is added from a burette.
- To ensure that farinograms from different samples can be compared, the midpoint of the farinograph bandwidth at the maximum resistance is always centered on the 500-FU line. This is accomplished by adjusting the amount of flour and water used.1,2
- The Farinograph records dough behavior under identical test conditions in which the mixing bowl is kept at constant temperature. Dough resistance against constant mechanical shear is recorded on a chart in the form of a torque-time curve.
Farinograph parameters
1. Water absorption (%)
The amount of water added to balance the farinograph curve on the 500-FU line, expressed as a percentage of the flour (14% mb). This parameter is useful in adjusting the water relationships in commercial doughs when flour changes.
2. Dough development time / mixing time or peak time
Provides the time (in minutes) between the origin (time zero) of the curve and its maximum (peak). It is used to make adjustments during mixing in commercial processes when the flour mixing requirements change. Stronger flours with higher protein content have a longer development time than weaker flours with equivalent particle size distribution.
3. Stability
Difference in minutes between the arrival time (the time at which the top of the curve reaches the 500-FU line) and departure time (the time at which the top of the curve falls below the 500-BU line). It is a measurement of how well a flour resists overmixing. Stronger flours are usually more stable than weaker ones from the same wheat class.
4. Mixing Tolerance Index (MTI)
Measured as the difference in Brabender units between the top of the curve at the optimum and the point on the curve 5 min later. The MTI indicates how fast the gluten structure breaks down after reaching its full development. Lower MTI values correspond to stronger flours, typically used in the production of high specific volume bread.

Application
Factors that affect farinograph parameters:
| Water absorption |
|
| Development time |
|
| Stability |
|
| Mixing Tolerance Index |
|
Farinograph parameters for selected flours*
| Straight-grade (75% extraction) | Patent (60% extraction) | |
| Water absorption (%) | 63.5 | 64.3 |
| Development time (min) | 8.3 | 9.5 |
| Stability (min) | 18.0 | 23.0 |
| Mixing Tolerance Index (FU) | 28 | 20 |
| Flour yield (%) | 75 | 60 |
| Protein content (%) | 13.0 | 12.5 |
| Ash (%) | 0.50 | 0.35 |
* In this example all flours come from the same wheat class (hard)
Using the farinograph for artisan bread production
References
- Posner, E.S., and Hibbs, A.N. “The Flour Mill Laboratory.” Wheat Flour Milling, 2nd printing, American Association of Cereal Chemists, Inc., 2011, pp. 47–99.
- AACC International. Approved Methods of Analysis, 11th Ed. Method 54-21. Farinograph Method for Flour. Final approval November 8, 1995; Reapproval November 3, 1999. Cereals & Grains Association, St. Paul, MN, U.S.A.

