Due to this tension, it is critical to assure dough extensibility is on point. Thankfully, there are a number of methods for testing and evaluating. The following test uses a Brookfield CT3 Texture Analyzer to measure and asses texture through compression.
The Kieffer Dough Fixture Method
A piece of dough is placed in the Kieffer fixture, and the tension test is performed. The Texture Pro C3 Software logs and analyzes the data.

The following graphs represent the findings:


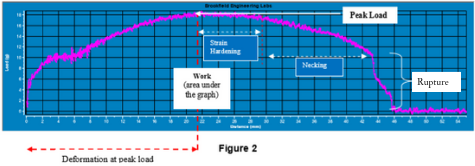
Here, the maximum peak force is a measure of sample tensile strength (elastic limit): the higher the value, the more the elastic component of the dough. Once the elastic limit of the dough has been reached, plastic deformation begins and the dough undergoes strain hardening. As the load exceeds the strength of the dough, necking begins until finally the dough reaches breaking point and ruptures. The mean load is the average load over a specified time period during the extension of the dough. A time period of 1-21 seconds has been used to calculate the mean load.
The Load/Distance graph for the hardness and extensibility of dough using a 6 mm cylinder probe:
The maximum peak value is a measure of sample tensile strength (elastic limit) and the area under the graph a measure of work done to extend and break the sample. From the graph the distance to breaking point is a measure of the extensibility of the dough: the greater the distance, the more extensible the sample.
The deformation at peak load is the distance to the maximum strength of the dough (elasticity, and strain hardening for plastic deformation). Beyond this point necking of the dough begins as the dough can no longer withstand the applied force. Here the load is seen to gradually drop as necking progresses until finally the dough ruptures seen by the sudden drop in load values.
Our observations on the test method and dough extensibility
When a trigger of 5 g has been detected at the sample surface, the probe begins to extend the sample upwards at a test speed of 2 mm/s over a distance of 70 mm. During this time the sample is deformed to breaking point. The maximum force value (see Figure 1 and 2) is a measure of the tensile strength (elastic limit) of the dough.
At load values below this, the dough can fully recover once the load has been removed i.e., the dough is elastic below the maximum force value. Once the elastic limit has been reached, plastic deformation occurs seen by the plateau on the graph (strain hardening) followed by necking (drop in load values over distance/time) and finally rapture.
The mean load is the average load applied to the dough throughout the test before breaking point. The mean load is calculated using the software over a specified time period on the load/time graph.
The work done to extend and break the sample is measured as the area under the graph. This is the energy required to overcome the strength of the internal bonds of the structural make-up of the dough.
The distance to breaking point is a measure of the extensibility of the dough; the greater the distance, the more extensible the sample. From the graph, the distance to breaking point is 43.5 mm for this sample.
To learn more about different methods of measurement, and the CT3 Texture Analyzer, send an email to [email protected].
The key is to know the strength of your dough, so adjustments can be made to the formula or process to ensure quality and consistency. Then you can step back and let dough extensibility do its job!

