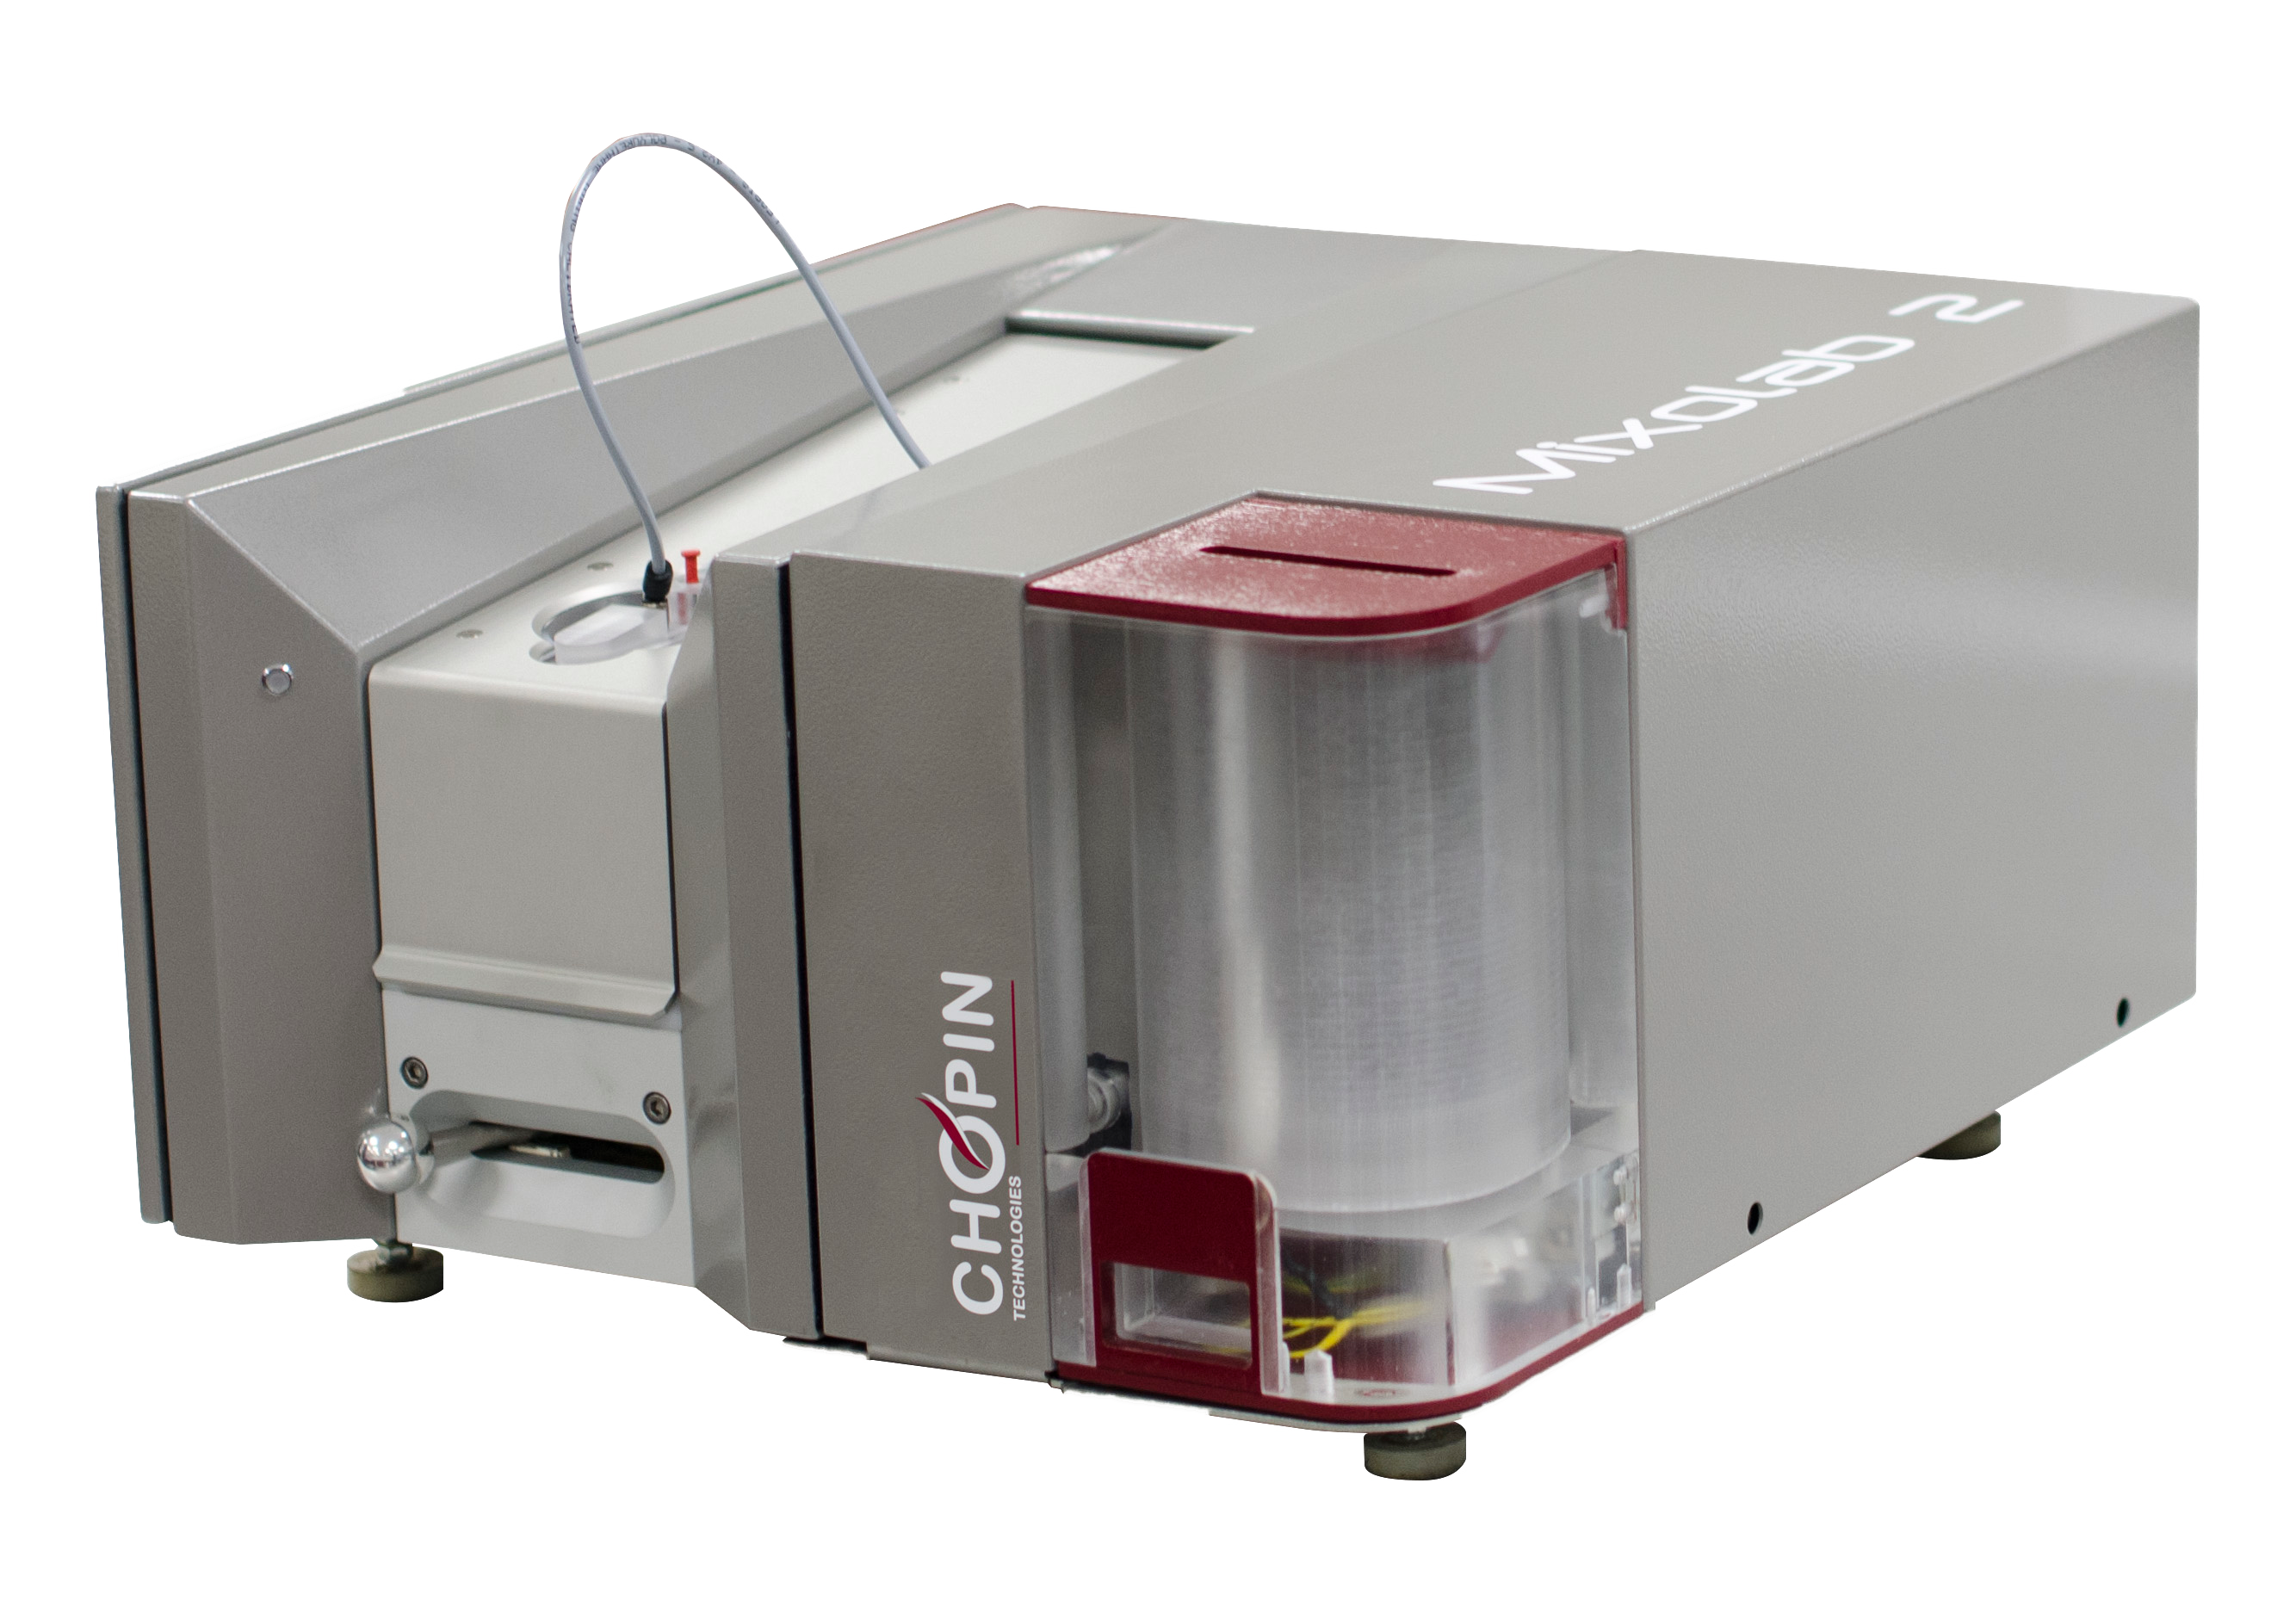
Mixolab
What is a Mixolab?
The mixolab is dough testing equipment used to assess the baking quality and performance of hydrated cereal flours. It’s used to characterize the rheological behavior and pasting properties of flour/water doughs and starch/water mixtures when subjected to the simultaneous action of mixing and heat transfer (changes in temperature).1,2
The mixolab helps millers and bakers to:
- Adjust dough mixing parameters
- Detect excessive enzymatic activity in wheat due sprout damage
- Evaluate starch damage
- Adjust flour’s alpha amylase activity
- Predict product behavior during thermal processing
- Assess the cold/hot functionality of starches and gums
- Study the effect of dough conditioners on dough mixing properties
Origin
The mixolab is a relatively new instrument. It was designed by Chopin Technologies and is based on the principles of the farinograph and viscoamylograph. It yields similar information and graphs to those obtained with the farinograph, mixograph, viscoamylograph and rapid visco analyser (RVA). This is why some cereal laboratories prefer to invest in this type of equipment instead of two or three.
How does it work?
The mixolab is a recording dough mixer with heating and cooling capabilities. It uses two mixing blades that rotate in opposite directions. The instrument can measure the consistency of dough in the temperature range of 86–194°F (30–90°C) during heating at a rate of 7.2°F/min (4°C/min).1,2,3
Evaluation of dough consistency over this temperature range allows the mixolab to determine complete characterization of the gluten-forming proteins and starch functionality in a single assay. These functions can be performed by measuring, in real time, sample resistance to mixing action of the kneading arms (i.e. torque in N·m), recorded by a computer software in a graph as changes in viscosity with time.
Application
According to AACC International Official Method 54–60.01 (Cereals & Grains Association), the mixolab test consists of the following steps:3
- Flour moisture should be determined prior to the test. Instrument will automatically adjust flour weight according to the moisture value on a 14% moisture basis.
- Input the test conditions (i.e. flour moisture content and desired water absorption).
- Weigh 45 g of test flour and place it into the mixolab mixer.
- Position the water injector.
- Conduct a preliminary test to determine if the selected water absorption is adequate for the run.
- Start the test and verify that during the first 5 minutes, the torque measured by sensor is within 1.10 N·m (C1 point in curve). If in range, allow test to continue. If not, stop the test and repeat procedure with an adjusted new water absorption.
- Allow instrument to continue and complete the test.
- Evaluate the 5 different phases of the mixolab curve or graph:
- Phase I (initial mixing, hold at 86°F or 30°C for 8 minutes). Evaluation of dough formation and weakening. The most important parameters are maximum consistency (C1 point in curve), time to maximum consistency, and dough stability (measured as the time in minutes in which torque is higher than maximum consistency).
- Phase II (weakening, heating from 86 to 140°F, 30–60°C). Evaluation of gluten weakening as a function of torque reduction, i.e. decrease in dough consistency (C2 point in curve). The 2 most relevant parameters are minimum consistency and dough temperature at minimum consistency. C2 represents the lowest point of the curve.
- Phase III (gelatinization, heating from 140–194°F, 60–90°C). Evaluation of starch gelatinization properties. The 2 most relevant parameters are minimum consistency (C3 point in curve) and dough temperature at minimum consistency. C3 indicates the maximum torque obtained after C2 during the heating phase. It corresponds to starch gelatinization measurement.
- Phase IV (stability during baking, hold at 194°F, 90°C). The most important parameters are gel stability minimum consistency during baking (difference between minimum consistency of phase III at point C3 and IV phase at point C4) and dough temperature at minimum consistency.
- Phase V (retrogradation, cooling from 194 to 140°F, 90–60°C). Evaluation of starch retrogradation. The most important parameter is the increase in torque between minimum consistency of phase IV and maximum consistency of phase V (C5 point in curve). Retrogradation is correlated to bread staling.
- Obtain the mixolab flour profiler graph and relate the 6 factors (mixing, absorption, retrogradation, viscosity, amylase, and gluten) to a reference or control flour.
Analysis protocol of the mixolab is completely customizable (i.e., mixing speed, temperature, water absorption). This allows for maximum flexibility and adaptability to user needs.
References
- Serna-Saldivar, S.O. “Quality Control of Cereal Grains and Their Products.” Cereal Grains: Properties, Processing, and Nutritional Attributes, CRC Press, Taylor & Francis Group, LLC, 2010, pp. 470–497.
- Pagani, M.A., Marti, Alessandra, and Bottega, Gabriella. “Wheat Milling and Flour Quality evaluation.” Bakery Products Science and Technology, 2nd edition, John Wiley & Sons, Ltd, 2014, pp. 43–47.
- AACC International. Approved Methods of Analysis, 11th Ed. Method 54–40.02. Determination of Rheological Behavior as a Function of Mixing and Temperature Increase in Wheat Flour and Whole Wheat Meal by Mixolab. Final approval May 28, 2010. Cereals & Grains Association, St. Paul, MN, U.S.A.

