If you’ve upgraded to a new oven, have you thought about how it will affect bake times? Running thermal profiles is the most reliable method for objectively adjusting the baking time and establishing the optimum bake temperature for different baked goods when using the oven for multiple products.
High-speed ovens may not be as flexible as their batch-type counterparts; however, when properly operated, high-speed ovens can produce equivalent quality attributes in pan (tin) bread, buns and even artisan-type breads. Whether the ovens are direct gas-fired, electric, hybrid, or indirect ovens, the principle remains the same; ovens transfer heat (both sensible and latent) to the products through the use of fundamental heat transfer mechanisms:
- Conduction between product and band.
- Forced convection through hot air recirculation.
- Radiation from walls and burners.
- Water vapor condensation on product surface after steaming.
Once inside the oven, the product absorbs heat and internal temperature rises. Thermal events are established and, if measured properly, bakers have the assurance that the dough is being baked at optimum heating rate. (Figure 2) Among these thermal events are:
1. Yeast kill
Percent of bake time at which center of dough reaches at least 60°C (131°F).
If the internal temperature of the product reaches the Yeast Kill point (that is at 50% bake time), it means the product is receiving sufficient heat flux (heat flow per unit area). Yeast kill is mainly triggered by conduction after the pan / tray and band have been heated enough to conduct energy to the dough at the highest rate possible. Early zone temperature setpoint adjustments regulate Yeast Kill occurrence.
2. Starch gelatinization and protein coagulation (dough-to-crumb transition zone)
Percent of bake time at which center of dough reaches at least 76°C (169°F).
Instead of being merely a point on the graph, starch gelatinization and protein coagulation take place within a rather wide range of temperatures which can be seen as a pronounced positive slope on the S-Curve graph. The exact point at which starch gelatinizes is highly dependent on water availability (which is controlled by flour absorption), starch granule size distribution and water competing substances, such as sugar, alcohols and salt, added to the formulation. Wheat starch in a bread formula does not gelatinize completely. However, it gelatinizes enough to create a strong porous structure from 60°C to about 82°C.
Generally, for an optimum baking process, 76°C (169°F) is the temperature the dough should reach after having undergone a 60 to 65% total bake time. If the dough takes too long to reach the reference temperature, there is a high probability that the product still has too much water in it and most likely will not have enough firmness and structure to support its own weight once sliced and packaged.
3. Arrival to final temperature
Percentage of bake time at which the center of dough reaches final and constant temperature of 94 – 96°C (201– 205°F) at standard atmospheric pressure (sea level).
| Internal Dough Temperature | Goal % of Bake Time | |
| Yeast Kill | 60° C/140° F | 50 – 55% |
| Gelatinization | 77° C/170° F | 60 – 65% |
| Arrival | 93° C/200° F | 85 – 88% |
Figure 2: Typical temperatures and percentages of bake time at which key S-curve milestones occur.
Dough internal temperature cannot exceed the saturation temperature of water at any given pressure. As the center of the product approaches asymptotically the boiling point of water, the dough reaches the maximum temperature possible at its core which is 94–96°C (201–205°F). Such temperature should be reached having passed 80% to 85% total bake time. The remaining time, i.e. 15 to 20% bake time, is mainly for crust thickening and color formation through Maillard reactions and sugar caramelization.
Zone temperature settings and total bake time adjustments make the biggest difference in moving the S-Curve parameters, which optimize crumb, texture and moisture content for a long shelf life. (See Figure 3 for optimization chart.) Often, additional capacity may be found in overall reduced bake times, which also saves energy and, therefore, achieves two business growth objectives.
S-Curve Trouble Shooting
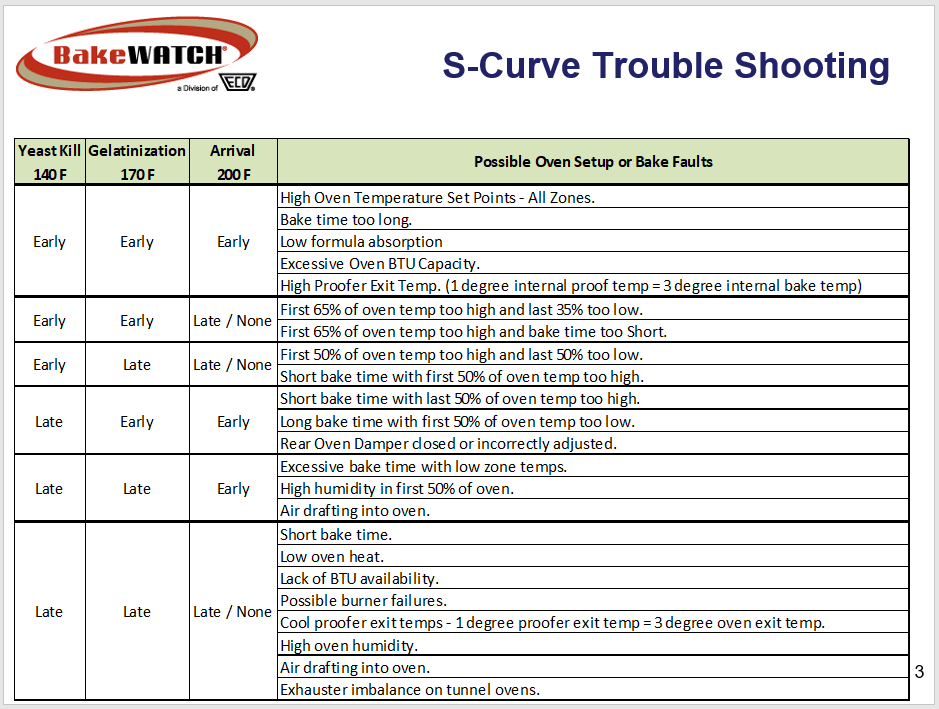
Figure 3: Oven settings guide for S-curve optimization.
Bakers willing to expand production to the next level should bear in mind that the most successful operations are those who pay attention to the details and do not sacrifice quality at the expense of poorly performing equipment and low-cost formulations which do not offer sufficient process robustness. Handling 10 pounds of dough in one hour is totally different from handling a 200- or 500-pound dough batch. The larger the dough batch, the more precise the dough processing technology required.
Sometimes the two most necessary ingredients for a successful scale up project are: 1) keeping things simple yet robust and flexible enough, and 2) a solid knowledge on bread science to support decision making.
