
Mixograph
What is the Mixograph?
The mixograph is a dough testing equipment used to assess the baking quality of flours from soft, hard and durum wheat. It provides information on the mixing and absorption characteristics of flour.
The mixograph helps millers, bakers and plant breeders to:
- Classify wheats according to baking strength and define their end use or application
- Optimize flour blends and streams at the mill
- Detect proteolytic activity (sprout damage) in wheat
- Evaluate the conformity of incoming flour at the bakery
- Adjust mixing time and water absorption
- Perform genetic improvement of wheat cultivars
- Study the effect of ingredients and dough conditioners on dough mixing properties
- Match quality of flour with type of bakery product
Origin
The mixograph was developed in the U.S. by two scientists, Swanson and Working, in the 1930s. The mechanics remains the same today, but improvements in its design were made the following decades to improve its reliability.
The mixograph equipment was originally commercialized in 1939 by National Manufacturing Co., a division of TMCO (Total Manufacturing Company) located in Lincoln, Nebraska which specialized in supplying laboratory equipment to universities and federal cereal chemistry research organizations.
How does it work?
The mixograph is a recording dough pin mixer that rapidly develops a dough sample. It measures and records resistance of a dough to mixing. It consists of small dough mixer constructed in such a manner that the force required (torque) to turn a head over a static bowl containing dough is measured and recorded as a graphical curve called mixogram.1,2
As the gluten-forming proteins hydrate and coalesce, they form gluten strands which bind together to form an elastic matrix. During measurement, the force increases to a maximum and then decreases as the dough is overmixed.
Two different sizes of mixographs are commercially available: 10 g and 35 g. The machine can be hooked up to a computer running a software program to provide detailed and accurate mixing data.2
According to AACC International Official Method 54–40.02 (Cereals & Grains Association), the mixograph test consists of the following steps:1,3
- Check the speed of the mixing head and the swinging arm.
- Adjust the range and settings of the instrument according to official method.
- Place ink in the pen and adjust mixograph paper so the test starts at zero point.
- Flour moisture and protein content should be determined prior to the test. Moisture is critical for sample weight while protein content affects water absorption.
- Keep flour sample in a sealed container to avoid moisture exchange.
- Before test, bring flour, water and bowl to room temperature (tempering to around 25°C).
- Weigh flour sample (35 g) on a 14% moisture basis (MB). Correction of flour weight should be made according to dry solids content.
- Place flour in the tempered mixing bowl.
- Calculate the desired water absorption according to the protein content. The following equation can be used:
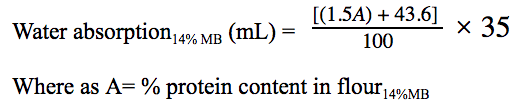
A different absorption can be determined by comparing curve characteristics with other mixograms having an “optimum” absorption.
- Fill burette with tempered water. Deliver the predetermined amount of water to the mixing bowl.
- Place mixing bowl containing flour sample and water. Lower mixing head.
- Graph paper and pen should be set and ready in position.
- Turn on equipment and allow to mix for 8 minutes.
- Turn off mixing head. Immediately check and register dough temperature.
- Determine dough properties (height of curve, angle and curve thickness before and after peak and optimum dough development time)
Parameters assessed by Mixograph:1,3
- Water absorption: The amount of water added affects the position and pattern of the curve on the graph paper. Less water increases dough consistency (torque) and moves the curve upward.
- Optimum development time (peak time): Time (min or sec) from the origin to reach the highest point on the center curve. At the peak, the dough has maximum consistency and optimum gas retention capacity. The intersection of lines drawn down the center of the ascending and descending parts of the curve is the peak time.
- Mixing tolerance (to overmixing): Directly related to the quantity and strength of gluten-forming proteins. The width of the mixogram and the angle of descent indicate the tolerance of the dough to overmixing. The wider the curve, the stronger the flour, and the more elastic and less extensible the dough will be. The steeper or the more pronounced the angle after peak, the less mixing tolerance.4
As a general rule, the higher the protein content and the stronger the interaction of gluten-forming proteins, the longer the development time, the higher the peak, and the greater the mixing tolerance of flour.
References
- AACC International. Approved Methods of Analysis, 11th Ed. Method 54–40.02. Mixograph Method. Final approval November 8, 1995; Reapproval November 3, 1999. Cereals & Grains Association, St. Paul, MN, U.S.A.
- Finnie, S., and Atwell, W.A. “Wheat and Flour Testing.” Wheat Flour, 2nd edition, AACC International, Inc., 2016, pp. 65–67.
- Serna-Saldivar, S.O. “Dry-Milling Processes and Quality of Dry-Milled Products.” Cereal Grains: Laboratory Reference and Procedures Manual, CRC Press, Taylor & Francis Group, LLC, 2012, pp. 149–151.
- MacRitchie, F. “Dough Rheology.” Concepts in Cereal Chemistry, CRC Press, Taylor & Francis Group, LLC, 2010, pp. 41–54.
