
Crumb Analysis
What is Crumb Analysis?
Crumb analysis is the visual quantification of the sliced surface area of a baked product. This technique is used to observe the internal cellular structure of yeast- and chemically-leavened products to help assess their texture, sensory and eating qualities.1
Main attributes determined by crumb analysis of breads and other baked goods include:2
- Internal cell shape
- Cell size and uniformity
- Cell wall thickness
- Porosity
- Color
Origin
Traditional sensory evaluation of bread has relied on human panels which are time consuming, expensive and have a subjective nature of scoring. With the advancement of photography and computer vision analysis, large bakeries have gradually moved to more objective methods for describing textural properties of baked goods.
The earliest published work on crumb analysis using computer vision technique was in 1992 by Bertrand and co-workers who correlated the crumb cell size and shape with the bread’s textural properties. Their study identified two-phase materials in the crumb, namely a solid phase (cell wall) and an air phase (air).3 Today, one of the most reliable imaging tools for crumb analysis that has become available to bakeries in the early 2000s is the C-Cell system. It originated in the UK and was quickly adopted by bakeries in Europe, the US and other industrialized countries.
How does it work?
As an essential tool in Quality and R&D programs in large bakeries, crumb analysis is used to indicate possible inconsistencies in the ingredients or process of making breads and other baked goods. Since this analysis is not quantifiable by the human eye, it is done using image analysis techniques.
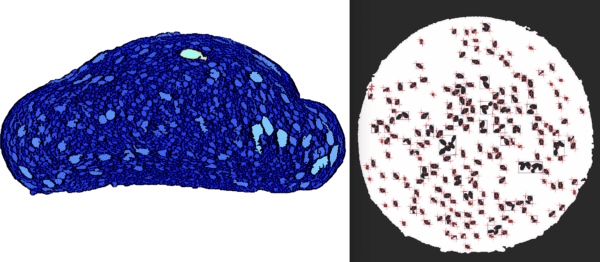
Uniformly sliced breads or cakes are photographed using a suitable camera with adequate resolution and under proper lighting. The captured images are digitized for subsequent image processing. Critical crumb attributes such as cell size, structure, color, uniformity, etc. are evaluated using computer programs based on pre-selected algorithms and compared to standard crumb scores. Here are examples of what the images look like for a slice of bread and a burger bun:
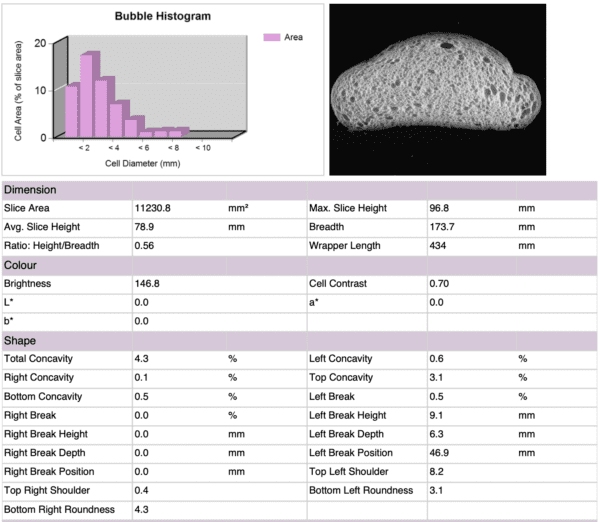
The AACC method 10-18.01 for evaluating crumb structure of baked goods relies on C-Cell Baked Product Analyser. Two models are available, C-Cell Mono & C-Cell Color, both running on the same software platform. The Mono and Color models measure 48 different parameters such as: dimensions, shape, cell size, elongation & orientation. The Color model has additional capability of measuring crumb / crust color and thickness as well as bespoke features for example quantifying cherries inside a cherry cake or sesame seeds on a burger bun.3
Here is an excerpt from a sample report:
Application
Bakery products have a characteristic shape and definite texture that is expected by consumers. Any significant deviation from optimal characteristics of the product is often considered a quality defect. Textural and sensory properties of baked goods are defined by the crumb’s three-dimensional structure that is created by microscopic and macroscopic components of the formula.
Image analysis has focused on the following variations in baked goods formulations:
- Determining the impact of wheat variety on baking qualities. Generally speaking, wheat cultivars with strong gluten (gluten index, GI>90) tend to show non-uniform and large crumb grains while finer and more uniform crumb grains are associated with cultivars with optimal gluten strength (gluten index, GI= 60-90). Corresponding penetration tests have confirmed that the non-uniform and large crumb grains had higher penetration values compared to the uniform and smaller crumb grains.4
- The possibility of discriminating between wheat and non-wheat components in bread as well as between milling fractions of hard and soft wheats.
- Correlating the contribution of emulsifiers and dough conditioners (DATEM and SSL, lecithin, phosphatidylcholine, sucrose esters) to bread’s overall sensory qualities.
General observations and guidelines for crumb analysis:
- The higher the number of cells along with higher mean cell area, the better the bread crumb porosity.
- Thin cell walls are prevalent in fine texture crumb while thick walls are dominant in coarse crumb.
- Industrial baguettes have higher porosity than denser whole wheat and traditional baguettes.
- Bread made with too much water or too little salt tends to have a highly porous structure with large cells like swiss-cheese structure.
- Crumb analysis can be beneficial in detecting potential damage in baked goods and can help in waste reduction.
References
- Cauvain, S.P. .The C-Cell image analysis system for objective measurement of bread quality. Proceedings of the ICC-SA/SACB Bread and Cereal Symposium, Johannesburg, South Africa ,2004, pp: 396-402.
- Whitworth, M., Cauvain, S. P. and Cliffe, D. Measurement of bread cell structure by image analysis. In Using cereal science and technology for the benefit of consumers, Proceedings of the 12th International ICC Cereal and Bread Congress, 23rd-26th May 2004, Harrogate, UK, Woodhead Publishing Ltd, Cambridge (Eds. S.P Cauvain, S.E Salmon and L.S Young), 2005, pp:193-198.
- AACC Method 10-18-01. Measurement of crumb structure of baked products by C-Cell. Baking Quality. AACC Approved Methods of Analysis, 11th edition.
- Magdić, D., Horvat, D., Drezner, G., Jurković, Z. and Šimić, G. Image analysis of bread crumb structure in relation to gluten strength of wheat. Poljoprivreda, 2006, 12, 1, pp: 58-62.
