
Alveograph
What is an Alveograph?
An alveograph is a rheological tool used to assess the baking performance of flours used in baked products (bread, noodles, tortillas, biscuits, etc.). It is based on injecting air into a thinly stretched sheet of dough to form a bubble, simulating gas/carbon dioxide release and retention during dough fermentation and oven spring during baking.
Bakers use alveograph data to gain understanding of fluctuations in dough rheological changes by assessing:
- Tenacity
- Elasticity
- Baking strength
- Resistance of dough to deformation
- Extensibility
Origin
The alveograph is a modified version of the extensometer which was invented by Marcel Chopin in 1920. The instrument was used to prove that the baking properties of bread were essentially dependent on the quality of wheats.2 The method applies to any type of wheat—from soft to hard—with a specific protocol for measuring Durum wheat flour. Relatively fast and simple compared to other means of measuring wheat flour performance, the alveograph is one of the most used quality control tools worldwide.
How it helps measures flour quality
How does it work?
The test is done with the following steps:3,4,5
- Prepare 250 g of flour and a sodium chloride solution (2.5% weight/volume). On the constant hydration method, the volume of water required to hydrate the flour to a predetermined value is adjusted according to the moisture content of the sample. An adapted hydration protocol (based on actual four water absorption capacity) is available.
- Mix and knead in a chamber for about 8 minutes to form a dough of proper rheology and consistency.
- Extrude the dough. This step aligns the gluten network and is very important to create repeatable and reproducible bubbles.
- Divide the extruded dough into five equal parts. Then, they are sheeted with a roll to obtain a fixed thickness (12 mm), followed by dough resting.
- Cut the dough sheets into discs using a die, and proof in an isothermal (temperature-controlled) box.
- Automatically inflate the dough disc by injecting air at constant pressure and flow rate until the resulting bubble bursts. Record the pressure inside the bubble and time it takes for the bubble to burst.
- Perform the test on the 5 individual patties, and average the pressure/time parameters.
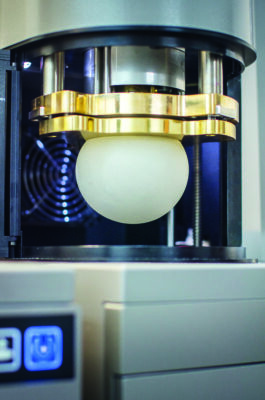
Alveolab by KPM analytics
Parameters measured by the alveograph test:2,4,5
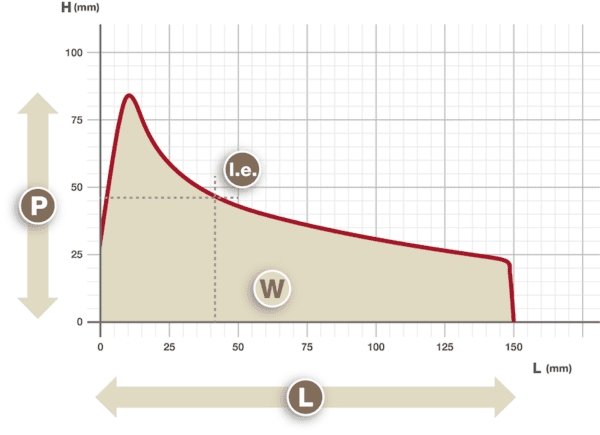
- P (y-axis): Maximum pressure required for the deformation of the sample or overpressure. P-value is graphically seen as the height of the peak and is related to the resistance of the dough to deformation (tenacity).
- L (x-axis): Maximum amount of air the bubble is able to contain. L-value is graphically seen as the length of the alveograph curve or distance at which the bubble ruptures, an indication of dough extensibility.
- Elasticity Index (Ie): Compares pressure after 200 mL volume of air has been blown into the dough test piece or bubble versus the maximum pressure (P).
- W: Indicates dough baking strength. W-value is graphically seen as the total area of the alveograph curve or total deformation energy. It represents the energy required to expand the dough and is related to flour strength. ‘W’ is generally much larger for hard wheat flours than for soft wheat flours.
- P/L ratio: is the quotient of the pressure required for deformation and the maximum amount of air that the bubble is capable of containing. It represents the balance of the elastic and viscous components of the dough.
- Swelling index (G): is the square root of the volume of air required to rupture the dough.
The alveograph helps millers and bakers to:
- Classify wheats or flours according to baking strength
- Optimize the flour blends and streams at the mill
- Detect proteolytic activity (sprout damage) in wheat
- Evaluate the conformity of incoming flour at the bakery
- Adjusting mixing, water absorption, proofing conditions for given doughs (time, relative humidity, temperature)
- Assess the need for dough conditioners (redox agents, emulsifiers, enzymes for strengthening or weakening of dough)
Unlike the extensograph, which uses tensile strength by stretching the sample dough piece in only one direction, the alveograph subjects the dough to extension in two dimensions.1
Critical factors for alveograph measurements:2
- Accuracy in moisture content determination: critical to salt concentration determination since it is calculated from the flour moisture content.
- Proper mixing and extrusion: over mixing or under mixing may cause error in the determination of L and W.
- Resting and inflating: the dough must rest 20 min in the resting compartment.
- Air flow: uneven air flow may affect both the L and W values.
Nevertheless, the test shows very precise standard method reports between-labs coefficient of variation of 7% for W, 4.7% for P, 4.1% for G, 3.9% for Ie.
An example of a typical alveograph curve:
Classification of flours according to avelograph parameters
Flour types are classified according to alveograph values in the following table:5
| Flour type | P/L ratio | W |
| Strong wheat flour | 0.7 | >230 |
| Intermediate wheat flour | 0.3 – 0.7 | 140-230 |
| Weak flour | 0.3 | <120 |
Official alveograph methods:
- AACC International Method 54-30.1999 (Alveograph Method for Soft and Hard Wheat Flour)
- ICC Standard No. 121. 1992 – Method for using of the Chopin Alveograph (matrix: wheat flour; analyte: rheological Properties)
- ISO International Standardisation Organisation EN NF ISO 27971 :2018 Cereals and cereal products – Common wheat (Triticum aestivum L.) – Determination of alveograph properties of dough at constant hydration from commercial or test flours and test milling methodology –
- And others (GOST-R, IRAM, GBT, etc.)
References
- Papageorgiou, M., and Skendi, A. “Flour Quality and Technological Abilities.” Engineering Aspects of Cereal and Cereal-Based Products, CRC Press (imprint of Taylor & Francis Group), 2014, pp. 130–131.
- Dubois, M., Dubat, A., and Launay, B. The AlveoConsistograph Handbook, 2nd edition, AACC International, Inc., 2008.
- Finnie, S., and Atwell, W.A. “Wheat and Flour Testing.” Wheat Flour, 2nd edition, AACC International, Inc., 2016, pp. 69–70.
- Chopin. “Alveolab Graph — Measure of dough tenacity, extensibility, elasticity and baking strength.” http://www.keydiagnostics.com.au/images/new2018/26%20Chopin/Alveograph/Alveolab%20LABgraph%20Brochure%20KD%2010-17.pdf. Accessed 20 May 2018.
- Serna-Saldivar, S.O. “Dry-Milling Processes and Quality of Dry-Milled Products.” Cereal Grains: Laboratory Reference and Procedures Manual, CRC Press, Taylor & Francis Group, LLC, 2012, pp. 151–153.
